School Desegregation – Object #7

2000-01 Enrollment and Racial Balance in the LRSD and PCSSD

Download chart

Click here to download all the charts as PDF

<p>These pages of the report on Enrollment and Racial Balance in the LRSD, PCSSD and NLRSD contain four charts each. The first on each page shows total enrollment between the 1988-1989 school year, which has decreased slightly between that date and 2000-2001. The charts on the bottom show enrollment — total enrollment, white enrollment, and black enrollment, broken into intervals of 5000 students. In these graphs the trend of increasing black enrollment and decreasing white enrollment over time is visible in LRSD schools, while area schools see an overall decrease in the white population and a sharp increase in the black population.</p>

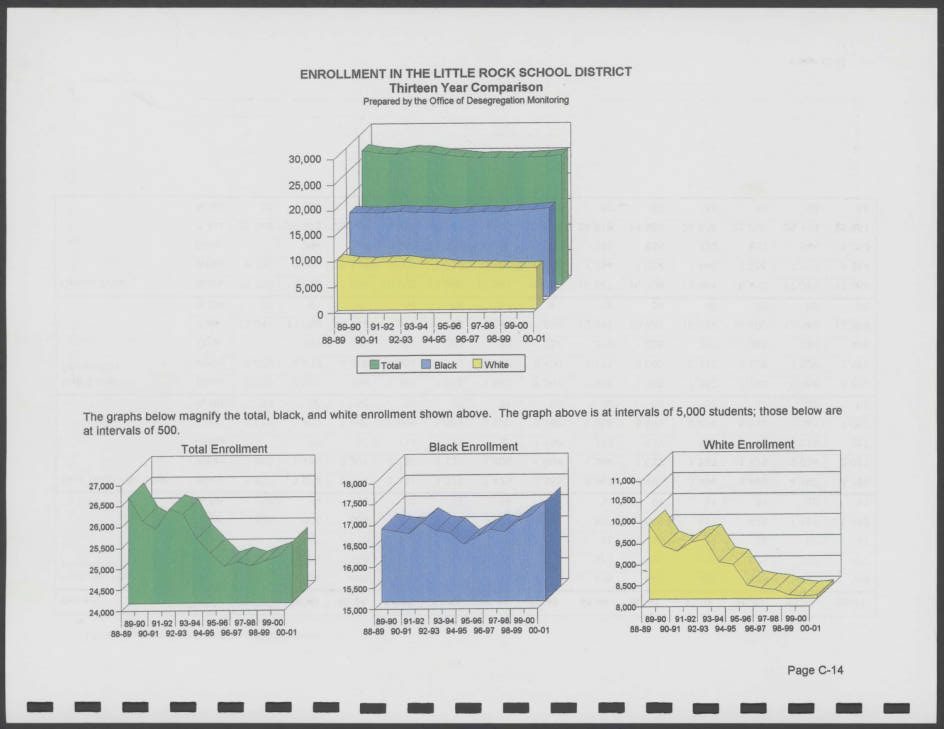
Charts illustrating enrollment by race in the Little Rock School District and LRSD area schools between 1988-1989 and 2000-2001 school years. Excerpt of a larger report to the Office of Desegregation Monitoring.

Questions:

Why do you think this primary source report was created? Who was the audience for this report?

Summarize the data presented in the charts. What can you learn from the chart about school desegregation?

What questions do you have after viewing these charts?

Citations

Office of Desegregation Monitoring Records (BC.MSS.08.37), Butler Center for Arkansas Studies.